Inside a 3,056-rated farming agent
The agents proposed strategies, wrote Python, ran games, inspected losses, and kept or rejected changes. Some repairs held up on the same recorded games. Others improved average cash while losing matches the previous policy had won. A better-looking experiment report could still leave me with a worse competition result.
This is a reconstruction from saved code, experiment reports, public replays, and submission receipts. “Day 0” means our earliest dated development report, August 10. The rating is the highest returned score among 66 archived submission histories we checked; it is not a claim of first place or a complete all-time record. History evidence ↗
From a crop loop to a competitive farm
Kaggriculture gives two players a 30-day season, with 24 decision steps per day. We buy land, hire workers, grow crops and tend animals. Both farms sell into one market: more output can depress the price. Winning means finishing with more banked cash after inputs, feed and wages. Travel consumes worker time that could otherwise service or deliver production.
By Generation 1, the baseline grew carrots with several workers. Generation 1 sent 21 experimenters after different hypotheses: crops, animals, labor, land, and delivery. The promoted melon strategy increased mean cash on the same development panel from 6,588 to 32,350. It won 52 of its 60 held-out tournament matches. Generation 2 combined activities into a portfolio allocator and reported 70 wins in a different 80-match tournament. These tournaments cannot be joined into one learning curve.
Single crops, species, workers and routes. A simple panel supplies rapid feedback.
Gen68 reaches 3,056.31. Surviving code matches the uploaded file hash.
Production, feed, wages and sales are evaluated together on fixed replay cases.
Broader controls, responsive opponents, runtime and extracted-archive checks.
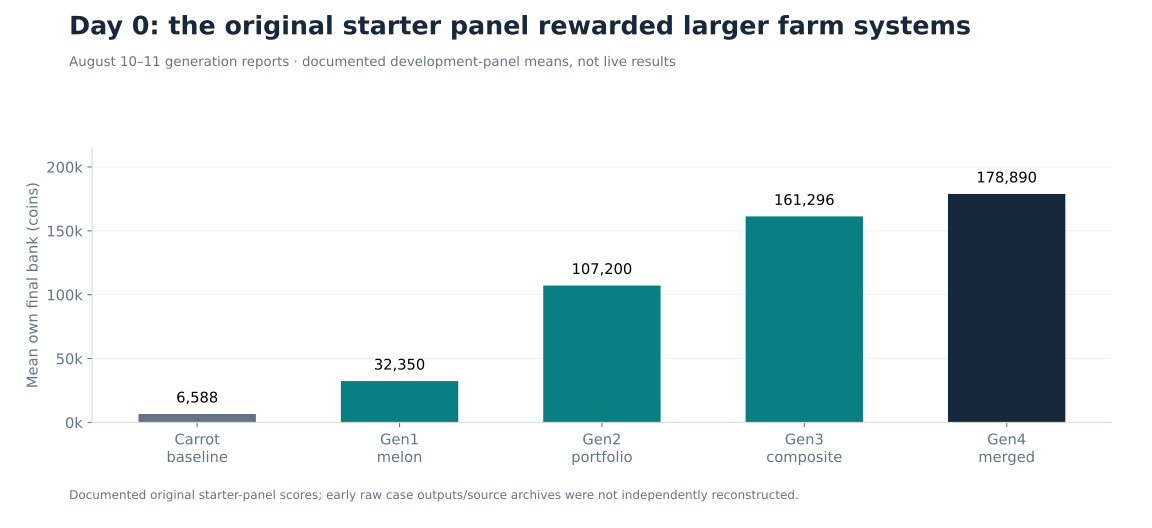
Early gains on the starter panel. These tests were separate from the later competition matchups.
Early gains included splitting feed pickups so the first carrier did not drain supplies needed by the others. Real opponent replays then exposed a larger weakness: starter-agent tests rewarded farms that struggled against aggressive land expansion and shared-market competition. A good crop had to remain profitable after both players sold it.
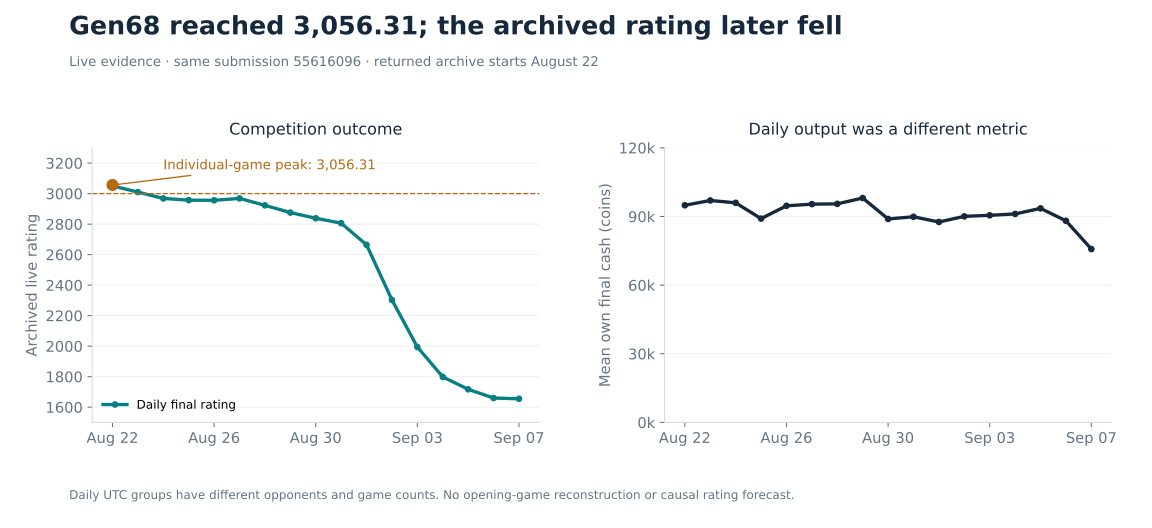
Gen68’s live rating after its August 22 peak. Daily cash stayed relatively steady as the opponents changed.
The autoresearch starting point
Our original program.md explicitly describes an adaptation of Karpathy’s autoresearch. His reference setup lets an agent edit training code, run a five-minute training budget, measure validation bits per byte, and retain or reject the experiment. A fixed evaluator makes the comparison meaningful. The instructions and experiment log are part of the research system.
We substituted a farming policy and game evaluations. The LLMs wrote and investigated Python; the submitted policy did not call an LLM during play. Initially, one evaluation contained 20 games against the starter and 20 against the current champion. A candidate needed no errors, improved head-to-head margin, and at least the champion’s starter-panel cash.
| Design choice | Karpathy’s reference | Our game-agent adaptation |
|---|---|---|
| Editable object | Training code in one file | Initially one policy file; later a frozen source tree |
| Feedback | Validation bits per byte | Wins, retained wins, own cash and opponent-relative margin |
| Evaluation boundary | Fixed preparation and evaluator | Fixed panels and engine, plus explicit opponent-model assumptions |
| Memory | Experiment instructions and results log | Logs, generation reports, rejected hypotheses and saved replays |
Karpathy’s agent instructions establish a baseline before changes and preserve failed results in the log. His 2019 training recipe also argues for inspecting data and verifying a simple evaluation pipeline before adding complexity. Both ideas mattered here: every economic intervention needed a checkable mechanism.
The research architecture
The research system had two jobs: explore ideas concurrently and make one defensible decision about what to keep. A coordinator read the rules, the current champion, and the accumulated learnings, then assigned a distinct hypothesis to each experimenter. Each experimenter worked in an isolated worktree and returned a candidate policy with its results.
Example hypothesis lanes; each produces separate code and a report.
The later research loop: parallel coding, serialized measurement, and evidence feeding the next generation.
The diagram combines the original coordinator/experimenter roles with the stricter evaluation process used in September. Early generations used different compute arrangements. By September 28, recorded benchmarks went through one shared queue, with at most three policy workers inside the active run. This kept competing experiments from changing timing-sensitive results simply by fighting for the same machine.
The coordinator rechecked promising claims and compared candidates with the champion. If the champion changed while another candidate was waiting, that candidate needed another comparison. Combining two successful branches also required a fresh test: workers, fertilizer, inventory and shared market prices made their gains interact.
What actually ran during a game
The coding agents belonged to the research loop. The submitted policy was Python and made no LLM calls during play. It received the current observation, chose actions, and returned commands to the game engine.
The checked benchmark wrapper rejected missing cases, duplicate episode/seat pairs, incomplete games and candidate errors. Later reviews examined ordered bank changes and actual paid inputs. A proposed wage saving had to account for the productive work being removed; a profitable harvest needed a funded delivery route.
We kept three kinds of evidence separate:
Opponent commands come from a saved game. Useful for matched repairs; limited when a real rival would change plans.
Opponent code acts on the changed game state. Fresh worlds help test effects beyond the repair panel.
Accepted uploads, hosted status and completed competition games. Local results do not establish a live rating.
What measurably improved
On one historical panel of the same 82 cases, the accepted Route848 baseline won 61 games. By Demand859V3, that became 79 wins and three losses. Improvements involved funded production and service, feed and fertilizer custody, competitive sale valuation, and returning output before the season ended. This was a repeatedly used development panel, so its improvement establishes repairs on those cases rather than unseen performance.
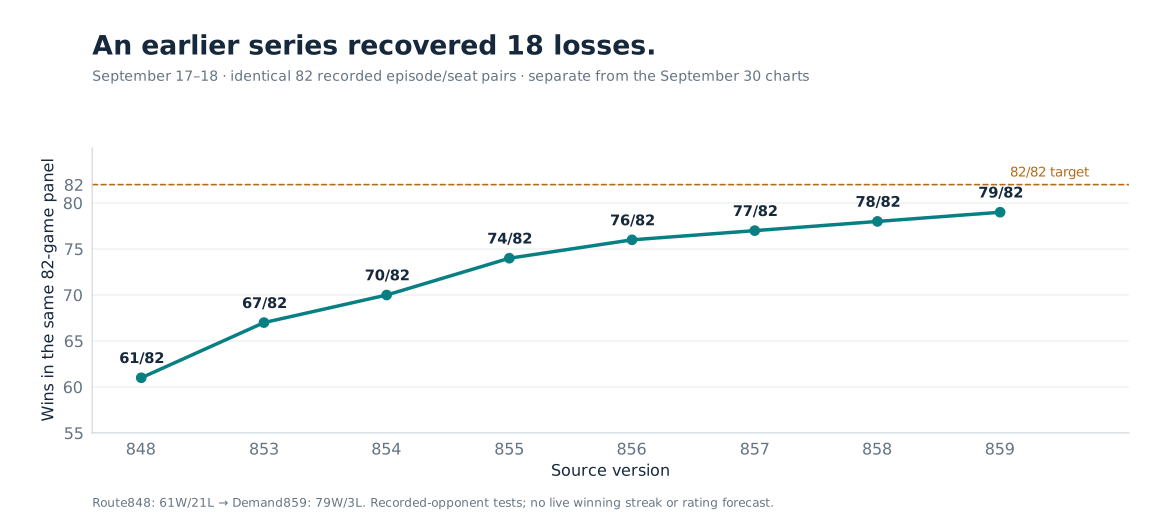
Wins on the same 82 recorded games rose from 61 to 79.
A separate September 30 panel tells a less flattering story. Versions 251, 336, 340, 361 and 397 each won 90 of the same 120 games, although their cash and margins differed. Version 340 earned more own cash than the final source on this panel; later choices also considered other difficult cases and runtime. There was no universal ordering of “best.”
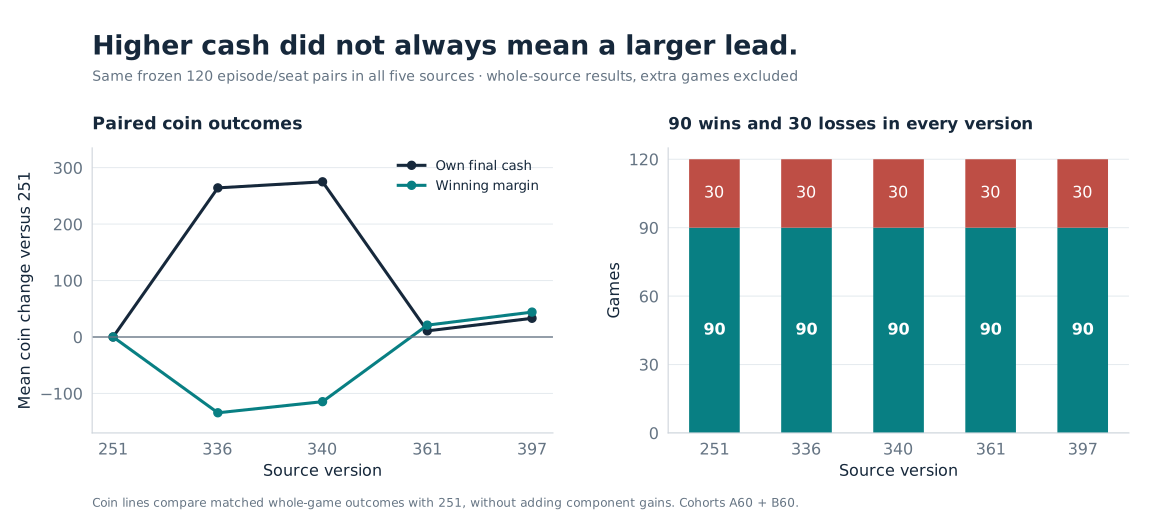
All five versions won 90 of the same 120 games. More cash did not always mean a larger winning margin.
What we learned from leaders
We inspected public farm states, labor, production and deliveries. A recent outcome-selected sample contained 29 own games and 25 leader views across 19 games. On engine day 6, leaders’ median farms had 22 strawberries, seven cows, three geese and nine paid hands; ours had 12, four, zero and seven. On day 10, our median cash was 15,589 versus their 3,869.
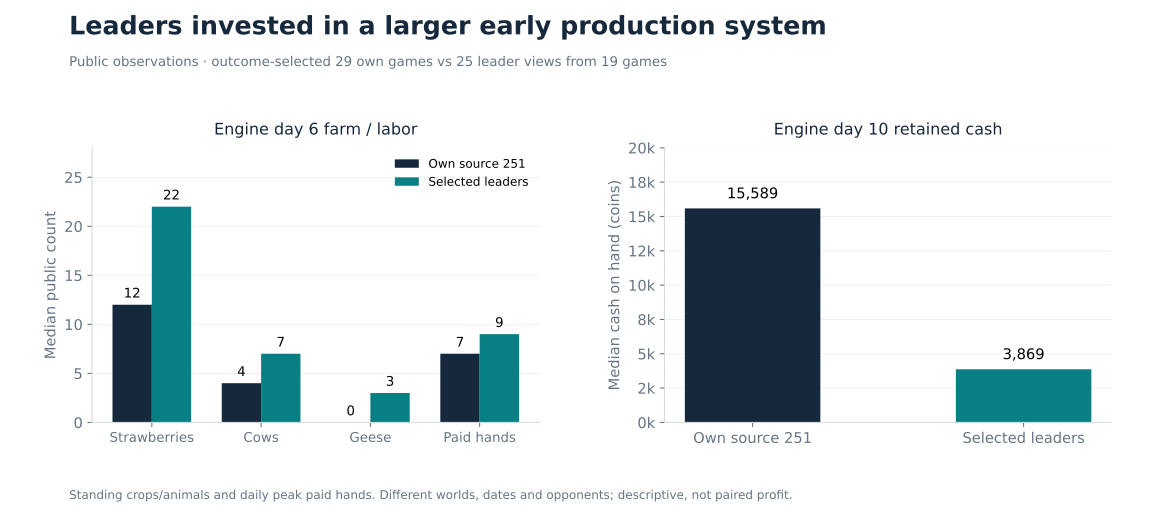
Public leader farms invested more in production and workers early in the season. These are observations from different games, not a controlled comparison.
The hypothesis was earlier capital deployment, followed by production that workers could actually service and deliver. A rival’s farm composition alone was insufficient: delivery timing, shared prices, purchased feed and escalating wages could reverse its economics. We needed to copy a mechanism and test it, rather than copy a board arrangement.
Explore the saved games
Choose a win or a loss, scrub through the season, and inspect the farms. The icons represent actual saved public states, with exact cash and worker positions. Tap a cell for its details. The viewer opens on day 6; slide back for the opening moves. The clock uses engine days 0–29. Recorded commands are requests, not proof of completed sales.
Replay a saved game
Saved public observations · no simulation
Our farm
Rival farm
🌾 Wheat · 🥕 Carrot · 🍈 Melon · 🍅 Tomato · 🍓 Strawberry · 🐄 Cow · 🐑 Sheep · 🪿 Goose
F Farmer · 2 Hands at this cell · diagonal fill: locked land
Select a farm cell to inspect its saved state.
Our command entering this state
Requested from the prior observation; completed fills are not inferred.
—
Watch or download the four 37-second videos
The silent clips show all 720 saved observations at 24fps, plus opening and final holds. Cash is never interpolated. Captions mark checkpoints; fullscreen makes the grid easier to inspect.
Recovering a loss: −15 → +753 coins
A last-day route in a 241-coin win
The fragile control: a 46-coin win
A completed game, a 1,226-coin loss
The clips are silent reconstructions from pinned replays, rather than original screen recordings. No policy or game engine was rerun. Only public farm states and our recorded commands are displayed. Case evidence · Video checks and source hashes. Gen68’s peak has a verified rating record, but no corresponding full replay was found in the saved records; its video is therefore absent.
Anomalies that changed our decisions
The narrow-panel mirage. A repaired historical-policy branch improved from two to six wins on 15 difficult cases, while losing both winning controls. The same exact source then won only 21/120, compared with its parent’s 90/120: five losses recovered, 74 prior wins lost. The small panel found behavior worth studying; it could not qualify a replacement.
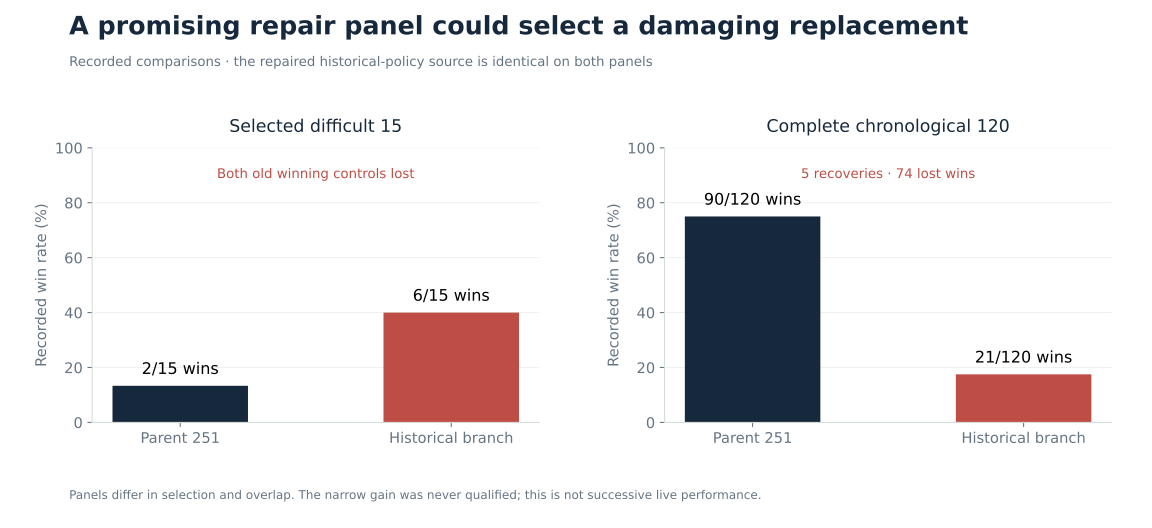
A targeted test looked promising; the broader panel revealed 74 lost wins.
The average concealed a loss. Candidate 390 improved mean margin over 191 recorded cases and recovered one loss, but lost two previous wins. In one, our cash rose by 86 coins while the rival’s rose by 358. Positive average income did not satisfy win preservation; the candidate was rejected.
A strategy could finish and still fail runtime. Candidate 388 recorded six wins and ten draws against a responsive opponent, but two own callbacks exceeded our local one-second criterion. Profiling identified repeated retirement-market calculations and route construction. Version 397 compared shortest routes before building commands and skipped empty market hours. Equivalent-function checks preceded full games. Its maximum own callback on a fresh 16-game panel was 0.786 seconds. The frozen peer still overran and remained explicitly unqualified; this was not a hosted latency guarantee.
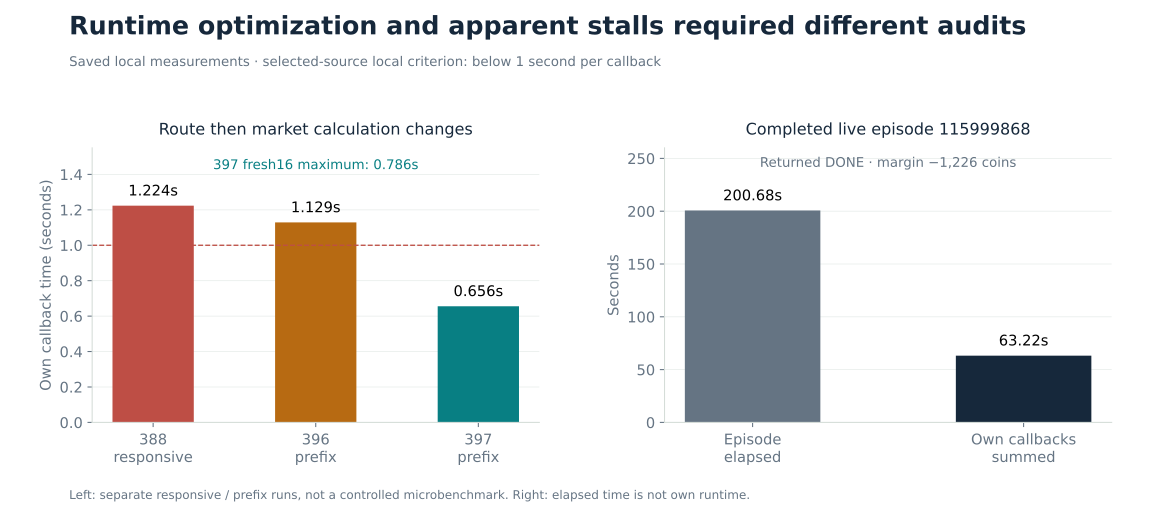
Callback runtime and total game duration measure different things. Neither chart alone explains the hosted loss.
Same cash did not mean the same path. An initial archive check matched 12 of 13 full paths. One 20-coin seed purchase shifted four callbacks; state later rejoined and both final banks matched. A predeclared repeat matched all 13. We retained both observations: the repeat did not erase the mismatch or prove universal determinism. Anomaly evidence ↗
The final result, without rounding away the losses
The final 397 source was accepted as submission 56722213 at 23:54 UTC on September 30. Its original saved hosted-status check remained unconfirmed at the research cutoff; the later official result is recorded in the closing section below. Local evaluation covered 133 recorded cases: 93 wins, 40 losses, retaining every parent win with zero new recoveries. Own cash improved in 41 cases and was equal in 92: 3,125 additional coins in total, or 23.50 per game. That was a small measured gain.
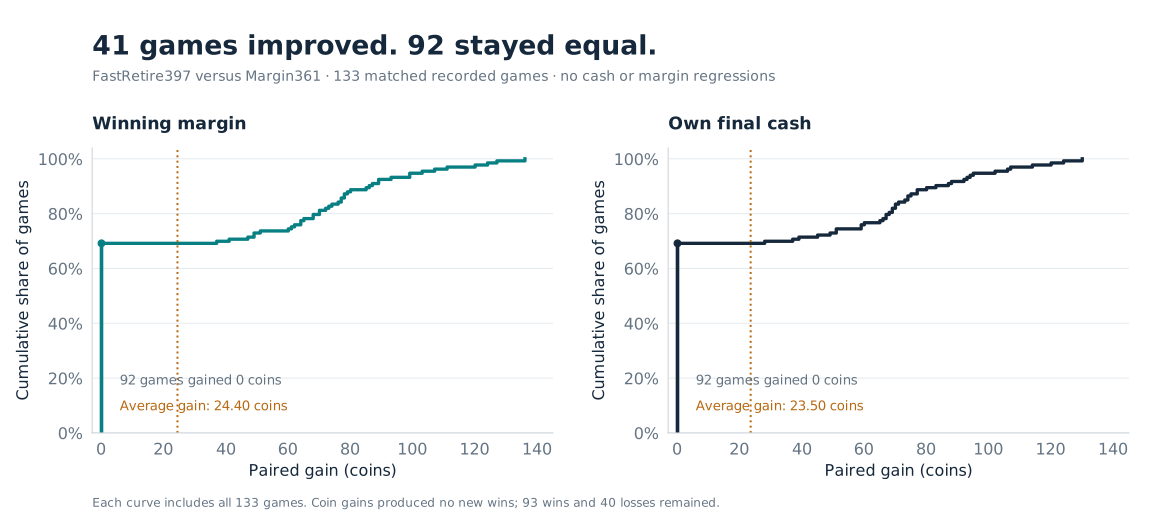
Final397 gained cash in 41 of 133 recorded cases, with no new wins.
The priority remained all first-40 wins, then all first-60 wins, then margins strictly above 30,000. One source had to meet each target; wins from different branches could not be added together.
Explore the final 60-game cohorts
Recorded opponent commands · exact source 397 · complete coverage, no imputed games
Margin > 30,000 Other win Loss · Select a game for cash and margin
View the complete static margin chart
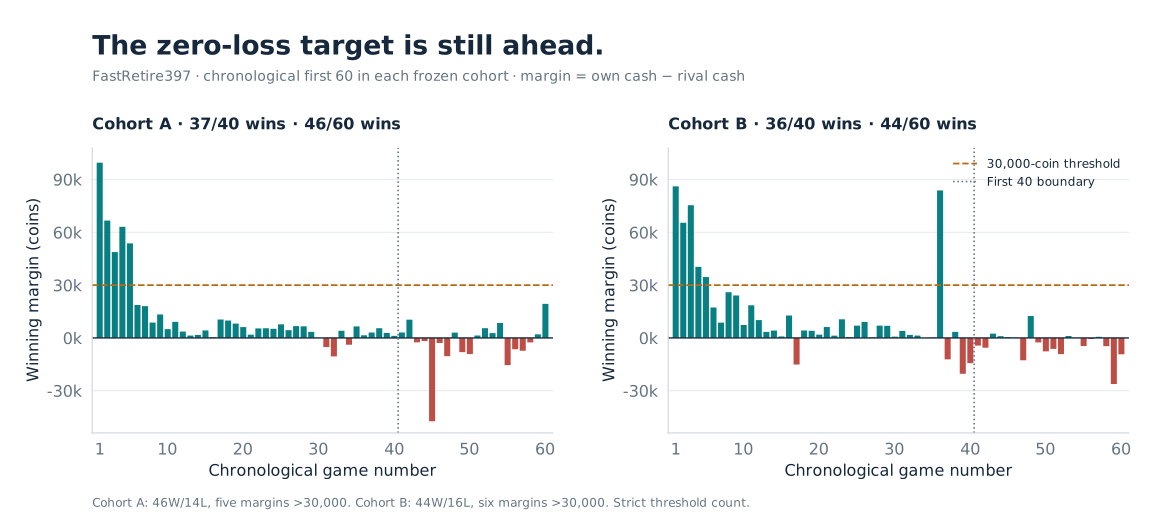
The target was not achieved. Cohort A ended at 37/40 and 46/60; B at 36/40 and 44/60. Only 11/120 margins exceeded 30,000. The live peak of 3,056 belongs to the archived Gen68 source, not this final upload.
The research loop produced real repairs and useful negative results. It also showed where our process became slow: repeatedly optimizing a familiar development set could yield small cash improvements while leaving strategic losses intact. A better next cycle would reserve unseen opponents earlier, test complete economic programmes, and rank hypotheses by plausible recoverable deficit. A launched run, a higher average, and a successful upload each answer different questions.
What the tests could tell us
A win means finishing with more banked cash than the rival. A recovery means winning a case the parent policy did not win. Gaining cash in an already-won game is useful, but it is not another recovered loss. That distinction explains why the final version could gain 3,125 coins across the recorded panel without adding a single win.
The final checks included 133 recorded games, 16 fresh responsive games, two known runtime cases, and 26 comparisons of the extracted submission archive. Those archive comparisons repeated existing cases; they were not 26 new opponents. The responsive panel used one frozen opponent, so it still offered limited evidence about how the policy would fare against the field.
I pinned the tested source, baseline, case list and submission archive so the results could be traced back to the code that produced them. The detailed evaluation notes, figure data, and failure analysis are available for readers who want to inspect the mechanics.
Ranking and closing results
The final upload completed, but it did not reproduce the historical 3,000-plus peak. A one-time official check at 8:14 p.m. Pacific on September 30 returned the results below. Submission scores, team placement and the archived peak describe different records. Download the dated closing evidence.
| Record | Verified result | What it establishes |
|---|---|---|
| Archived Gen68 peak | 3,056.31 | August 22 live rating; no contemporaneous rank located. |
| Historical team placement | 13th · 2,943.4 | September 13, 6:02 p.m. Pacific snapshot; not the final competition placement. |
Earlier Margin361 upload56719676 | 2,145.4 · COMPLETE | Official submission score at the closing check. |
Final397 upload56722213 | 1,647.7 · COMPLETE | Official submission score at the same check; below the earlier upload. |
| Settled final competition rank | Unverified | Our team was absent from the returned first 200 leaderboard rows. That response does not establish an exact or settled final placement. |
| Final397 recorded cohorts | A: 37/40 · 46/60 B: 36/40 · 44/60 | Complete local panels; zero-loss targets remained unmet. |
The 1,647.7 result is part of the outcome, even though the final local candidate preserved wins and gained cash. These two uploads did not play a matched live schedule, so their score difference cannot isolate the effect of the code change. The practical lesson is to judge promotion using broader responsive opponents and live feedback, while retaining the exact failures that the development panel missed.
References
- Andrej Karpathy, autoresearch, original README. The fixed evaluation instrument, bounded experiments and human-authored research programme informed our adaptation.
- Andrej Karpathy, autoresearch agent programme. Baseline measurement, experiment logging, and keep/discard decisions. Observed repository and file revisions are saved in reference notes.
- Andrej Karpathy, A Recipe for Training Neural Networks, April 25, 2019. Data inspection, simple evaluation baselines and incremental hypothesis testing. This is a methodology reference, not a separate autoresearch blog post.
- Kaggle, Kaggriculture leaderboard. The official closing submission/leaderboard API snapshot is bundled in dated results; final placement remains unverified.
- Project records: hashed documentation inventory, pipeline design audit, and development and live-rating evidence. These distinguish documented starter experiments, matched recorded panels and archived live history.
- Experiment analysis: exact figure datasets and anomaly evidence. The figure datasets cover all nine Matplotlib charts.
- Game visualizations: interactive replay provenance and video provenance. Both reconstruct saved public states; they are not new simulated results or original screen recordings. The video manifests also contain frame mappings and source hashes.
Results use records through September 30, 2026, including the official closing check at 8:14 p.m. Pacific. Supporting records are linked above.
Cite this post
If you reference this post in your work, please cite it as:
@article{nagabhushanaradhya2026kaggricultureautoresearch,
  author  = {Nagabhushanaradhya, Subramanya},
  title   = {Inside a 3,056-rated farming agent},
  journal = {subramanya.ai},
  year    = {2026},
  month   = {September},
  url     = {https://subramanya.ai/2026/09/30/kaggriculture-autoresearch/}
}